From Microevolution to Macroevolution
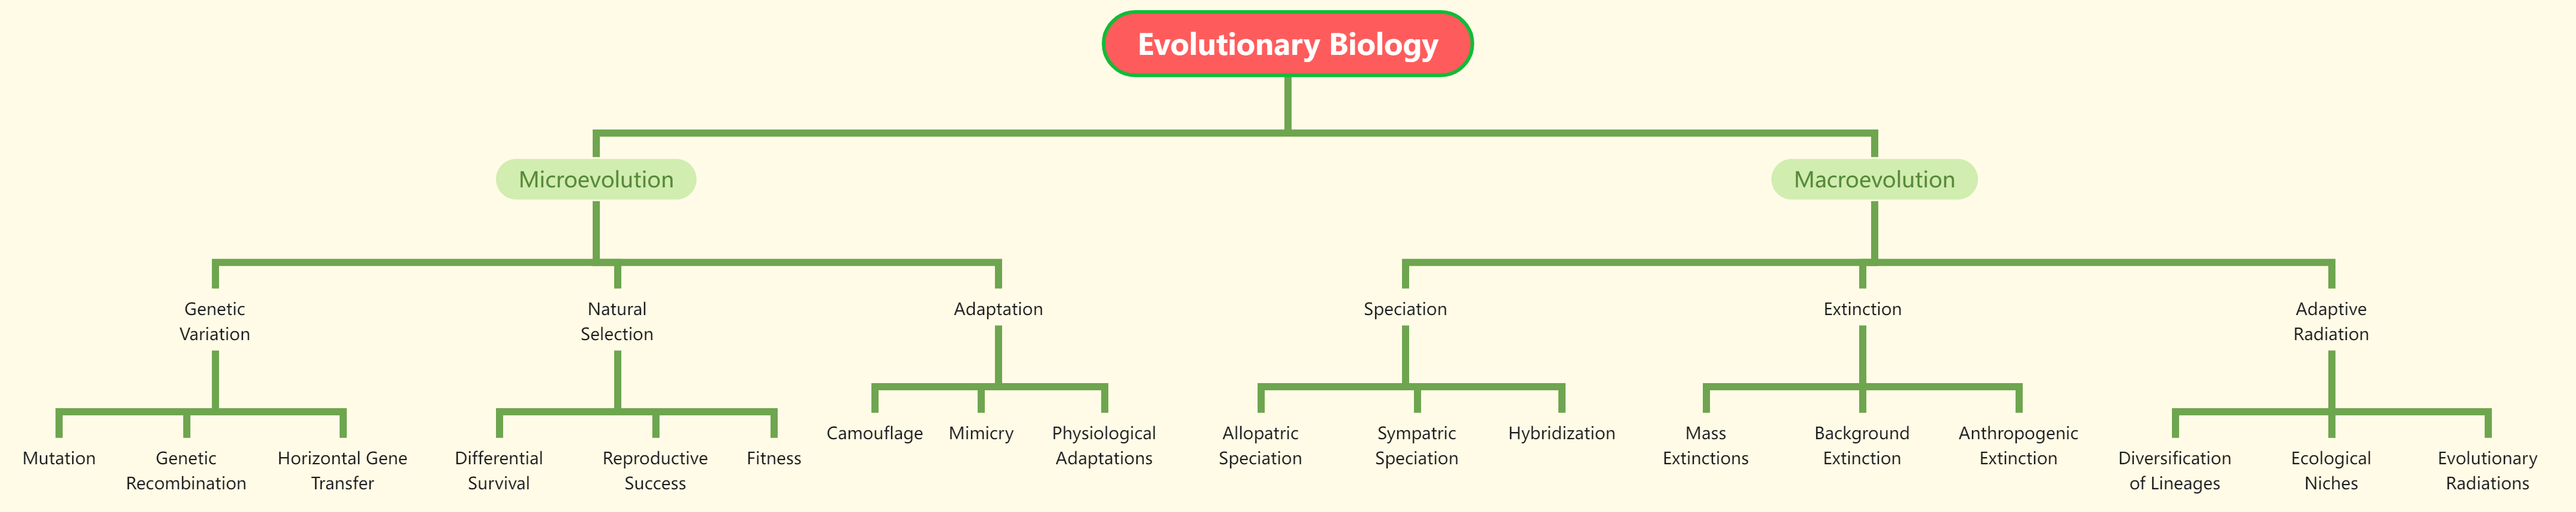
The mind map explores the realm of Evolutionary Biology, dissecting the subject into Microevolution and Macroevolution. Microevolution, the study of small-scale changes within populations, is divided into Genetic Variation, where Mutation, Genetic Recombination, and Horizontal Gene Transfer are discussed. The concept of Natural Selection is intricately detailed, covering Differential Survival, Reproductive Success, and Fitness. Adaptation, a key evolutionary process, is further delved into with examples like Camouflage, Mimicry, and Physiological Adaptations.
Macroevolution, on the other hand, extends the scope to large-scale evolutionary changes, with a focus on Speciation, including Allopatric Speciation, Sympatric Speciation, and Hybridization. Extinction is examined through Mass Extinctions, Background Extinction, and Anthropogenic Extinction. The mind map also touches on Adaptive Radiation, exploring the Diversification of Lineages, Ecological Niches, and Evolutionary Radiations. Overall, the mind map provides a comprehensive overview of Evolutionary Biology, shedding light on the intricate processes that drive both micro and macro-scale evolutionary changes, offering valuable insights into genetic variations, adaptation mechanisms, speciation, and the broader patterns of life’s evolution.
Unveiled Visual Clarity with Tree Charts
The tree chart stands out as an exceptional tool for content display due to its innate ability to visually represent hierarchical structures and relationships with clarity and simplicity. Its hierarchical format, resembling the branches of a tree, offers a top-down view that organizes information in a logical and easy-to-follow manner. This structured presentation aids in conveying complex relationships, dependencies, and categorizations, allowing viewers to grasp the content’s hierarchy at a glance. With each node representing a specific piece of information, and branches indicating connections, the tree chart offers a visual roadmap that enhances understanding and facilitates effective communication. This makes it an invaluable tool across various fields, from organizational structures and project management to family trees and classification systems, providing a concise and intuitive means of displaying content in a way that is both accessible and insightful.
Visualize Your Ideas with VP Smart Board
Visual Paradigm Smart Board offers a seamless and user-friendly platform for effortlessly creating a variety of mind maps. Whether you’re brainstorming ideas, planning projects, or organizing complex concepts, the Smart Board’s intuitive interface and versatile features empower users to generate mind maps with ease. From capturing and connecting thoughts to visually mapping out intricate relationships, Smart Board’s customizable styles ensure a dynamic and efficient mind mapping experience. With Visual Paradigm Smart Board, the process of crafting diverse mind maps becomes not only accessible but also a fluid and enjoyable endeavor, adapting to the unique needs and creative preferences of individuals and teams alike.