Understanding Hierarchy with Tree Chart
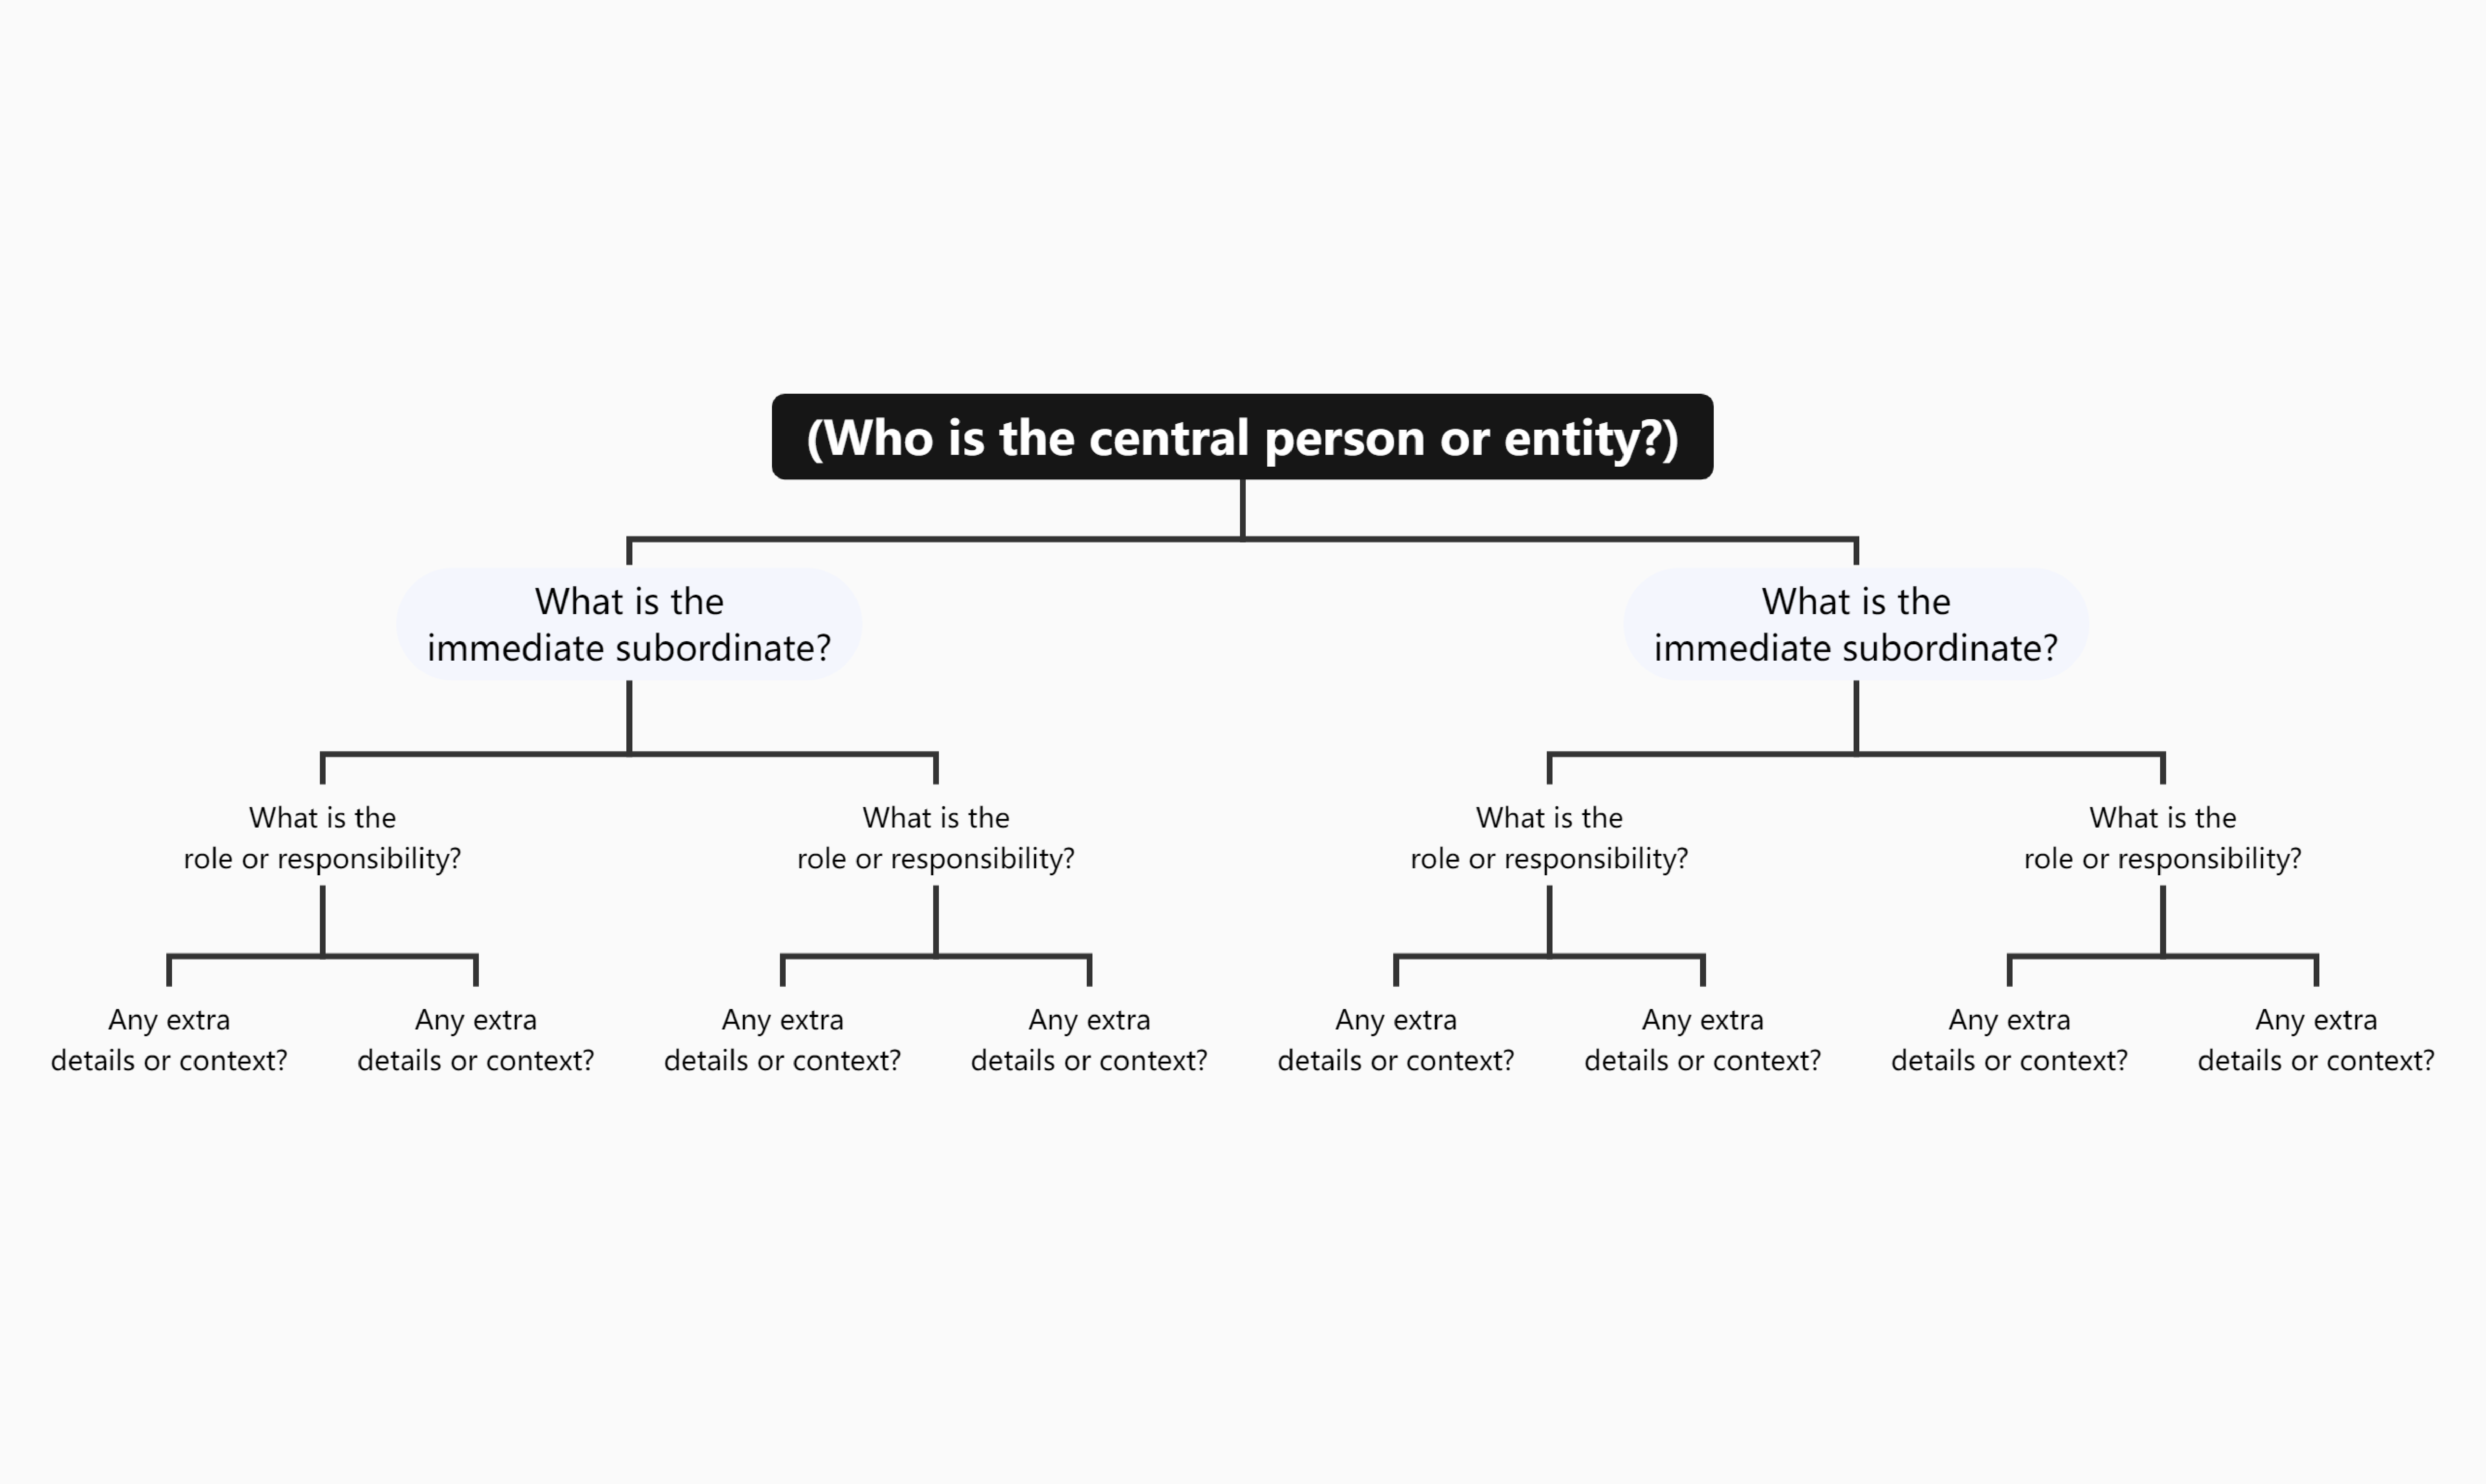
A tree chart, often referred to as a tree diagram or hierarchical chart, is a visual representation of hierarchical structures, relationships, or classifications. It utilizes a tree-like structure with a single root node that branches out into interconnected nodes or leaves, representing different levels of a hierarchy. Each node typically signifies a category, concept, or element, and the connecting lines illustrate the hierarchical relationships between them. Tree charts are employed in various contexts, such as organizational structures, family trees, decision trees, and classification systems. They provide a clear and visually intuitive way to represent complex information and showcase the hierarchical relationships and dependencies within a system or framework. Tree charts are versatile tools that aid in conceptualizing, organizing, and presenting hierarchical structures in a comprehensible and structured manner.
Distinguishing Tree Charts and Mind Maps
While both tree charts and mind maps are visual tools used to represent hierarchical structures, they differ in their applications and visual styles. Tree charts typically follow a strict hierarchical layout, with a central root node branching out into subordinate nodes, forming a clear and organized structure. They are often used for organizational charts, family trees, and decision trees, where a formal hierarchy is essential. In contrast, mind maps are more fluid and organic, allowing for non-linear, radial structures with a central idea connected to various branches. Mind maps are versatile tools for brainstorming, idea generation, and capturing interconnected concepts. While tree charts emphasize hierarchy and structure, mind maps prioritize creativity, flexibility, and the exploration of ideas in a more free-flowing manner. Ultimately, the choice between a tree chart and a mind map depends on the nature of the information being represented and the preferred visual style for conveying that information.
Crafting Tree Charts with Precision using VP Smart Board
Crafting structured tree charts is made effortless with Visual Paradigm Smart Board, a powerful and intuitive platform designed to streamline your diagramming experience. Whether you’re mapping out organizational hierarchies, project structures, or decision trees, Visual Paradigm Smart Board provides a user-friendly interface and robust features that facilitate the creation of clear and visually appealing tree charts. The platform’s drag-and-drop functionality, coupled with real-time collaboration capabilities, empowers users to design hierarchical structures collaboratively and efficiently. Embrace the precision and efficiency of Visual Paradigm Smart Board to bring your structural tree charts to life in a digital and collaborative space, where simplicity meets sophistication for effective diagramming and visualization.