Decoding Factors in Workplace Incidents
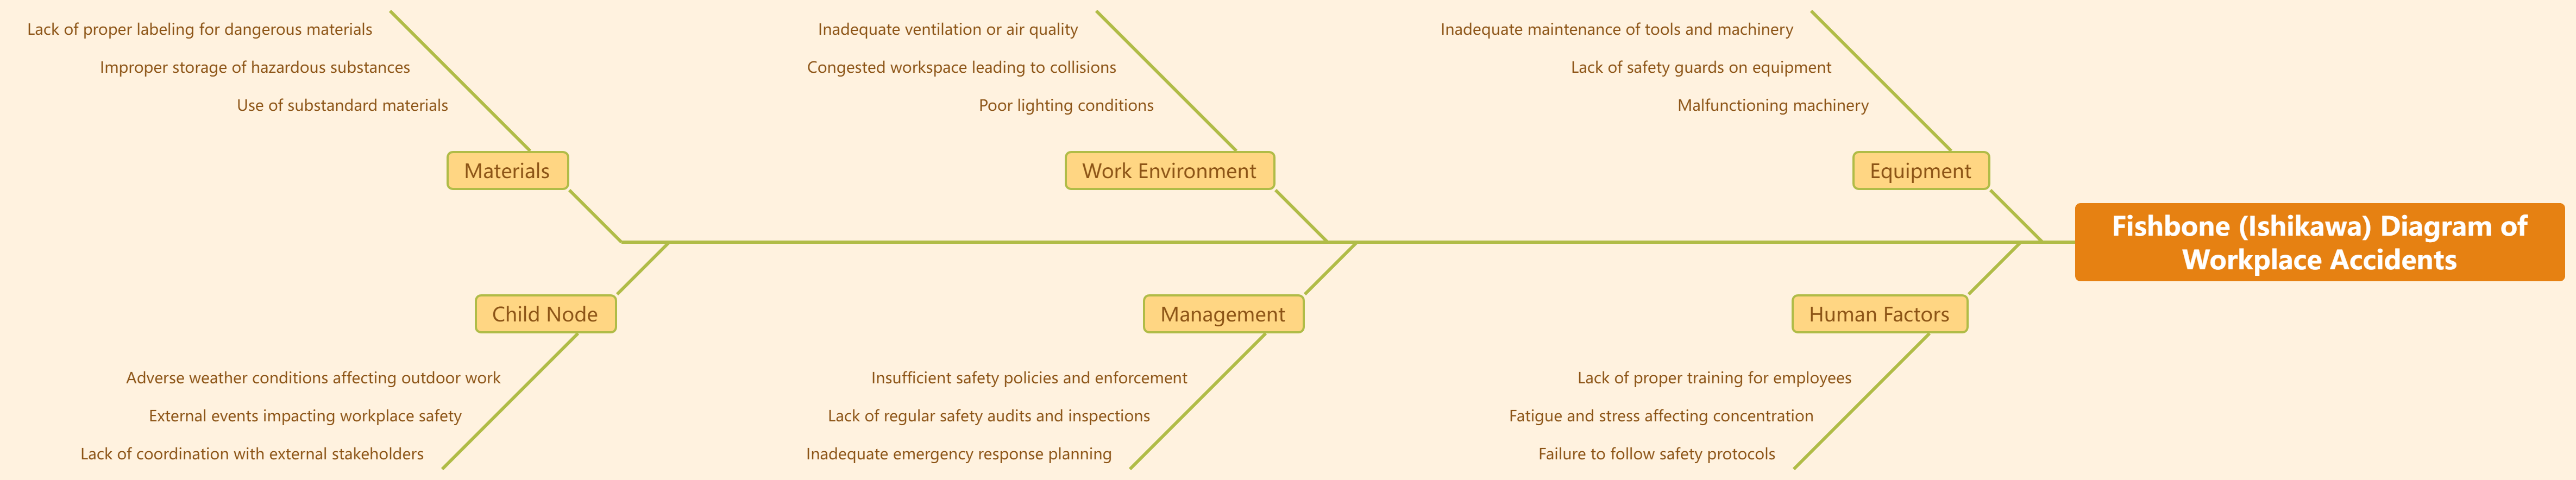
The Fishbone (Ishikawa) Diagram of Workplace Accidents delves into the multifaceted factors contributing to incidents in the workplace. By categorizing these factors into Equipment, Human Factors, Work Environment, Management, Materials, and external influences under Child Node, the diagram provides a holistic view of potential causes. It underscores the interconnected nature of workplace safety, illustrating how issues in equipment maintenance, human training, and management policies can cumulatively contribute to accidents. This visual representation aids in systematically identifying root causes, fostering a proactive approach to safety improvement. By utilizing this Fishbone diagram, organizations can better understand the dynamics of workplace accidents, leading to informed decision-making and the implementation of targeted safety measures.
Guide to Fishbone Diagrams in Root Cause Analysis
A Fishbone (Ishikawa) Diagram, often used in root cause analysis, is a visual tool that helps identify the potential causes of a specific problem or issue. To create a fishbone diagram, you typically start with a clear understanding of the problem at hand, which is articulated as the “fish’s head.” The problem statement should be concise and specific. The “spine” of the fish represents the major categories or causes contributing to the problem. These categories, often denoted as branches, can include factors such as Equipment, Human Factors, Work Environment, Management, Materials, and more, depending on the nature of the problem. Subsequently, you identify and document the potential causes or factors within each category, branching out like fishbones. This systematic approach allows teams to explore various dimensions of the problem, fostering a comprehensive understanding and aiding in the identification of root causes. The Fishbone Diagram is a powerful tool for visualizing complex issues, encouraging collaboration, and facilitating problem-solving in a structured manner.
Root Cause Analysis Made Easy with VP Smart Board
Visual Paradigm Smart Board stands out as a powerful and user-friendly tool for effortlessly creating Fishbone (Ishikawa) diagrams to analyze and prevent project delays. With its intuitive interface and a rich array of templates, users can easily navigate through the various factors contributing to delays and identify potential root causes. The platform’s flexibility allows for seamless customization, tailoring the Fishbone diagram to specific project contexts. By offering a comprehensive solution, it enables users to effectively manage ideas, systematically mark down issues, and visualize their work, fostering a proactive approach to problem-solving and project management.