Versatility of Fishbone Diagrams
The Fishbone Diagram, also known as the Ishikawa Diagram, is a powerful visual tool widely used for problem-solving and root cause analysis. Its primary purpose is to identify and explore the various potential causes contributing to a specific problem or effect. The diagram takes its name from its distinctive fishbone-shaped structure, where the “bones” represent different categories of factors that could influence the issue. These categories often include People, Process, Equipment, Materials, Environment, and Management (the 6Ms). The Fishbone Diagram is a collaborative tool that encourages teams to brainstorm and visually organize their thoughts regarding potential causes. It is commonly employed in various industries, such as manufacturing, healthcare, and project management, to systematically analyze complex problems and uncover the root causes, ultimately facilitating effective problem resolution and continuous improvement.
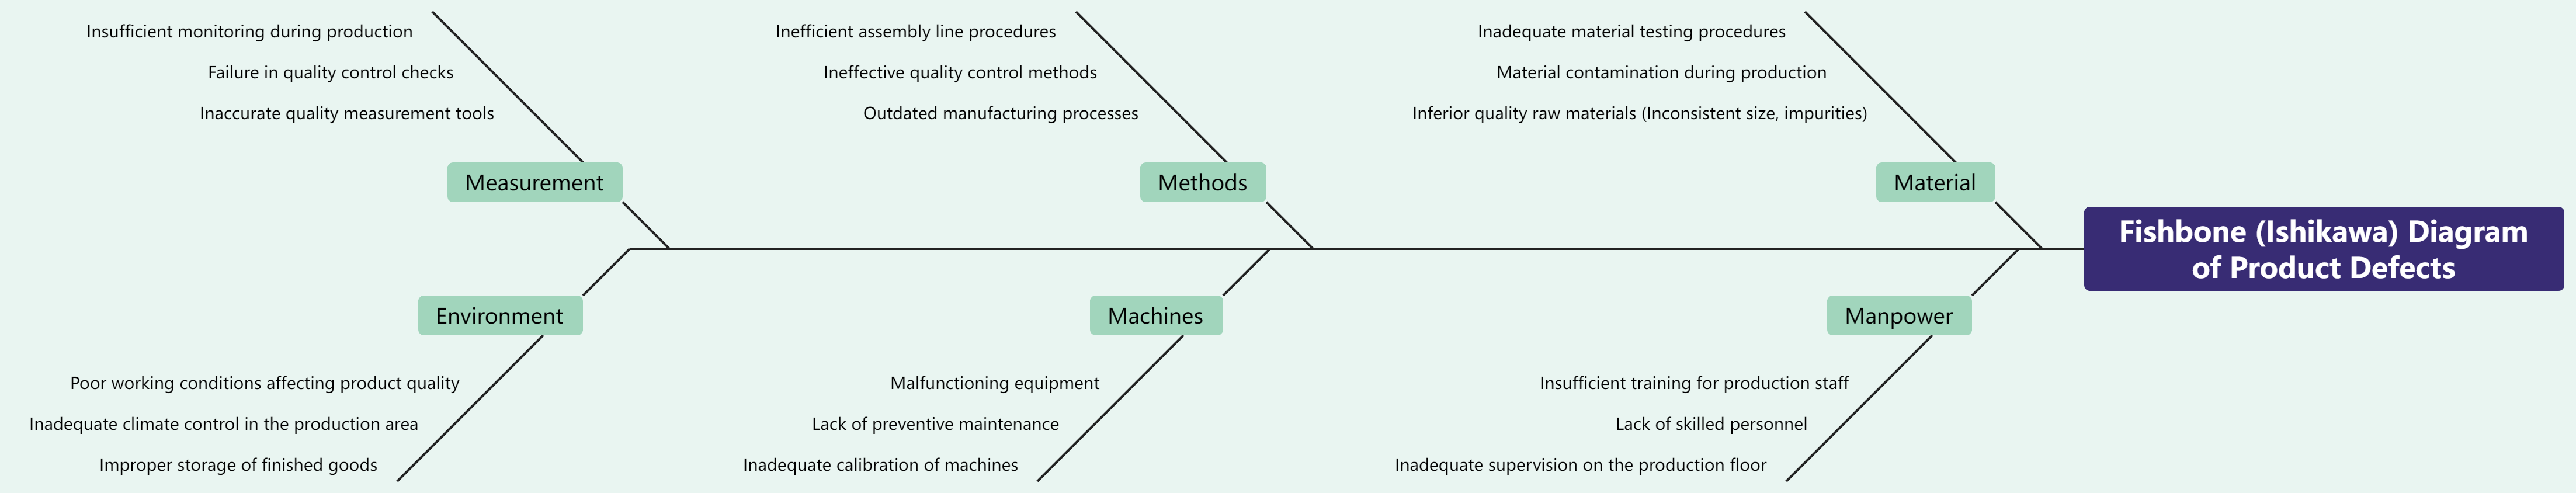
Fishbone Analysis of Product Quality Issues
The Fishbone Diagram of Product Defects provides a comprehensive overview of potential causes contributing to defects in a product, utilizing the classic six categories: Material, Manpower, Methods, Machines, Measurement, and Environment. By visually organizing these factors in a fishbone structure, the diagram allows for a systematic analysis of various root causes associated with product defects. In the Material category, issues such as inferior quality raw materials or material contamination during production are identified. The Manpower section highlights challenges related to training, skill levels, and supervision of production staff. Methods and Machines categories delve into outdated processes, quality control methods, and equipment malfunctions, while Measurement focuses on inaccuracies in quality measurement tools and monitoring procedures. Lastly, the Environment category addresses factors like poor working conditions and climate control. The Fishbone Diagram serves as a valuable tool for teams to collaboratively pinpoint and address the root causes of product defects, fostering a proactive approach to quality improvement in the production process.
Unleash Creativity with Visual Paradigm Smart Board
Visual Paradigm Smart Board stands out as a professional and versatile tool for effortlessly creating a variety of mind maps, including the intricate structures required for in-depth analysis. With a user-friendly interface and a plethora of pre-designed structures, including the fishbone structure, Visual Paradigm Smart Board simplifies the process of visual brainstorming and problem-solving. This tool empowers users to choose from a range of templates tailored to their specific needs, ensuring a seamless experience in mapping out ideas, processes, and root causes. Whether you’re dissecting product defects or exploring complex issues, Visual Paradigm Smart Board provides the flexibility and functionality needed to bring your thoughts to life visually. It’s the go-to solution for professionals seeking a comprehensive and intuitive platform to create mind maps that drive effective decision-making and problem resolution.