Visualizing Inventory Issues: Ishikawa Diagram Deconstruction
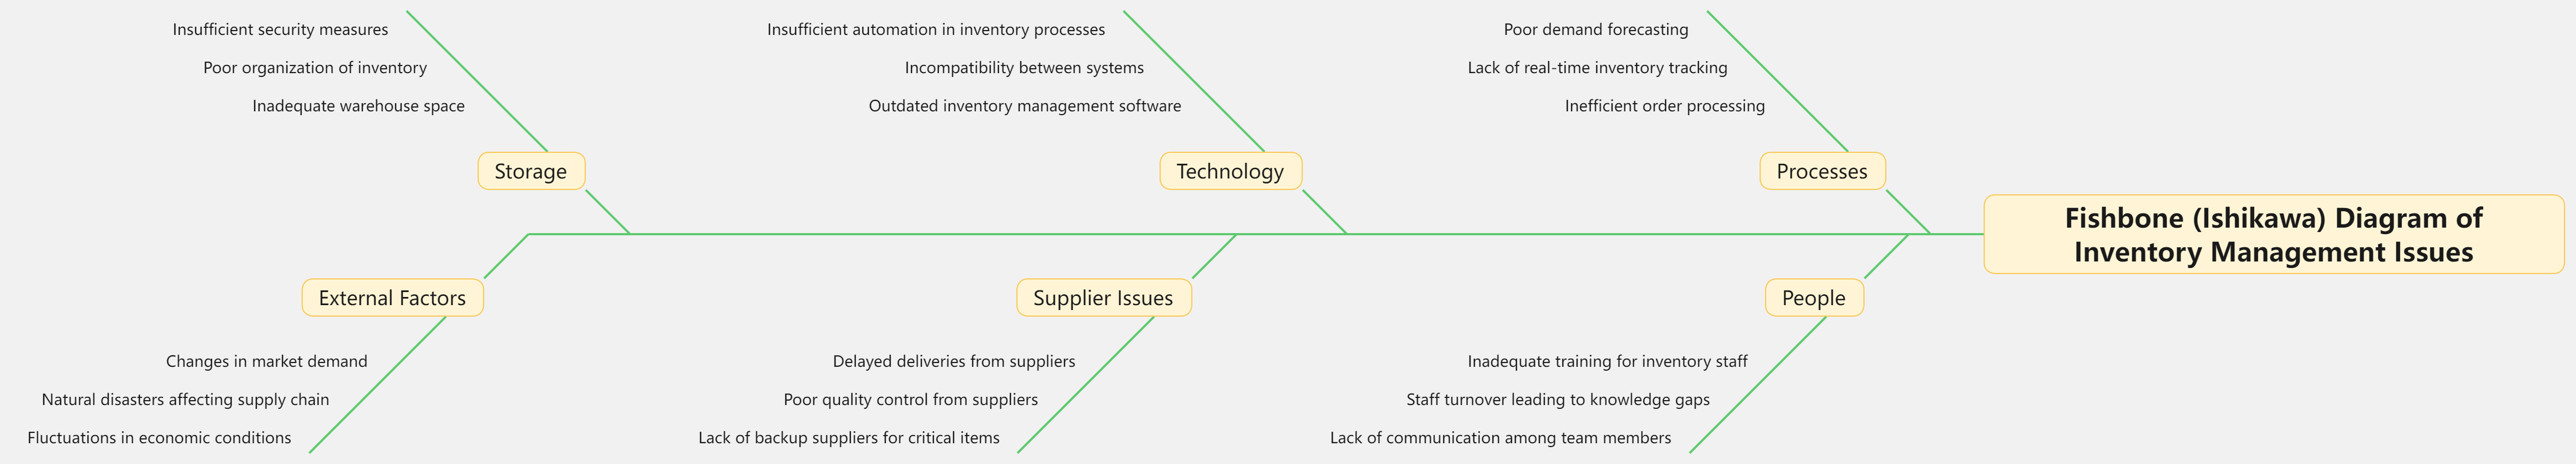
The mind map illustrates the complexities of inventory management issues using a Fishbone (Ishikawa) Diagram. The primary categories include Processes, People, Technology, Supplier Issues, Storage, and External Factors, each contributing to challenges within the inventory management system. For instance, inadequate order processing, lack of real-time tracking, and inefficient demand forecasting fall under Processes. People-related issues, such as insufficient training and communication gaps, add another layer of complexity. Technology issues, like outdated software and system incompatibility, highlight the critical role of technology in inventory management. Supplier-related challenges, storage problems, and external factors, such as market changes or natural disasters, further emphasize the multifaceted nature of inventory management. This comprehensive visualization allows for a holistic understanding of the interconnected factors contributing to inventory issues and provides insights for effective solutions. Utilizing tools like Visual Paradigm Smart Board enhances collaboration and ease in creating such insightful diagrams.
Visualizing Problem-Solving with Fishbone Diagram Advantage
The Fishbone (Ishikawa) Diagram, also known as the cause-and-effect diagram, stands out as a powerful tool for visually dissecting complex problems and identifying their root causes. What sets it apart is its ability to present a comprehensive view of potential causes within various categories. The diagram’s structure, resembling a fish skeleton, allows teams to systematically explore factors related to a particular issue, such as processes, people, technology, and external influences. Its popularity stems from its simplicity and effectiveness in promoting a structured approach to problem-solving. Teams opt for the Fishbone Diagram because it encourages collaboration, facilitates brainstorming, and ultimately helps uncover the core issues impacting a situation. This visual representation aids in fostering a shared understanding of the problem, making it an invaluable asset in problem-solving processes across diverse industries.
Streamlining Ideas: Dynamic Mind Maps with VP Smart Board
Visual Paradigm stands out as a robust tool for seamlessly creating various mind maps, providing users with a plethora of advantages in their visualization endeavors. The platform offers an intuitive interface coupled with an extensive library of templates, facilitating a quick start for users. With Visual Paradigm, users can effortlessly translate intricate concepts into visually compelling representations. The tool’s versatility allows for the creation of Fishbone (Ishikawa) Diagrams, enabling users to delve into the root causes of complex issues with ease. Beyond fishbone diagrams, Visual Paradigm covers a spectrum of structures, making it an ideal companion for diverse mind mapping needs. Whether navigating intricate projects or brainstorming creative ideas, Visual Paradigm stands as a reliable and efficient tool, enhancing collaboration and understanding through its visual representation capabilities.