Power of Fishbone (Ishikawa) Diagram in Problem Solving
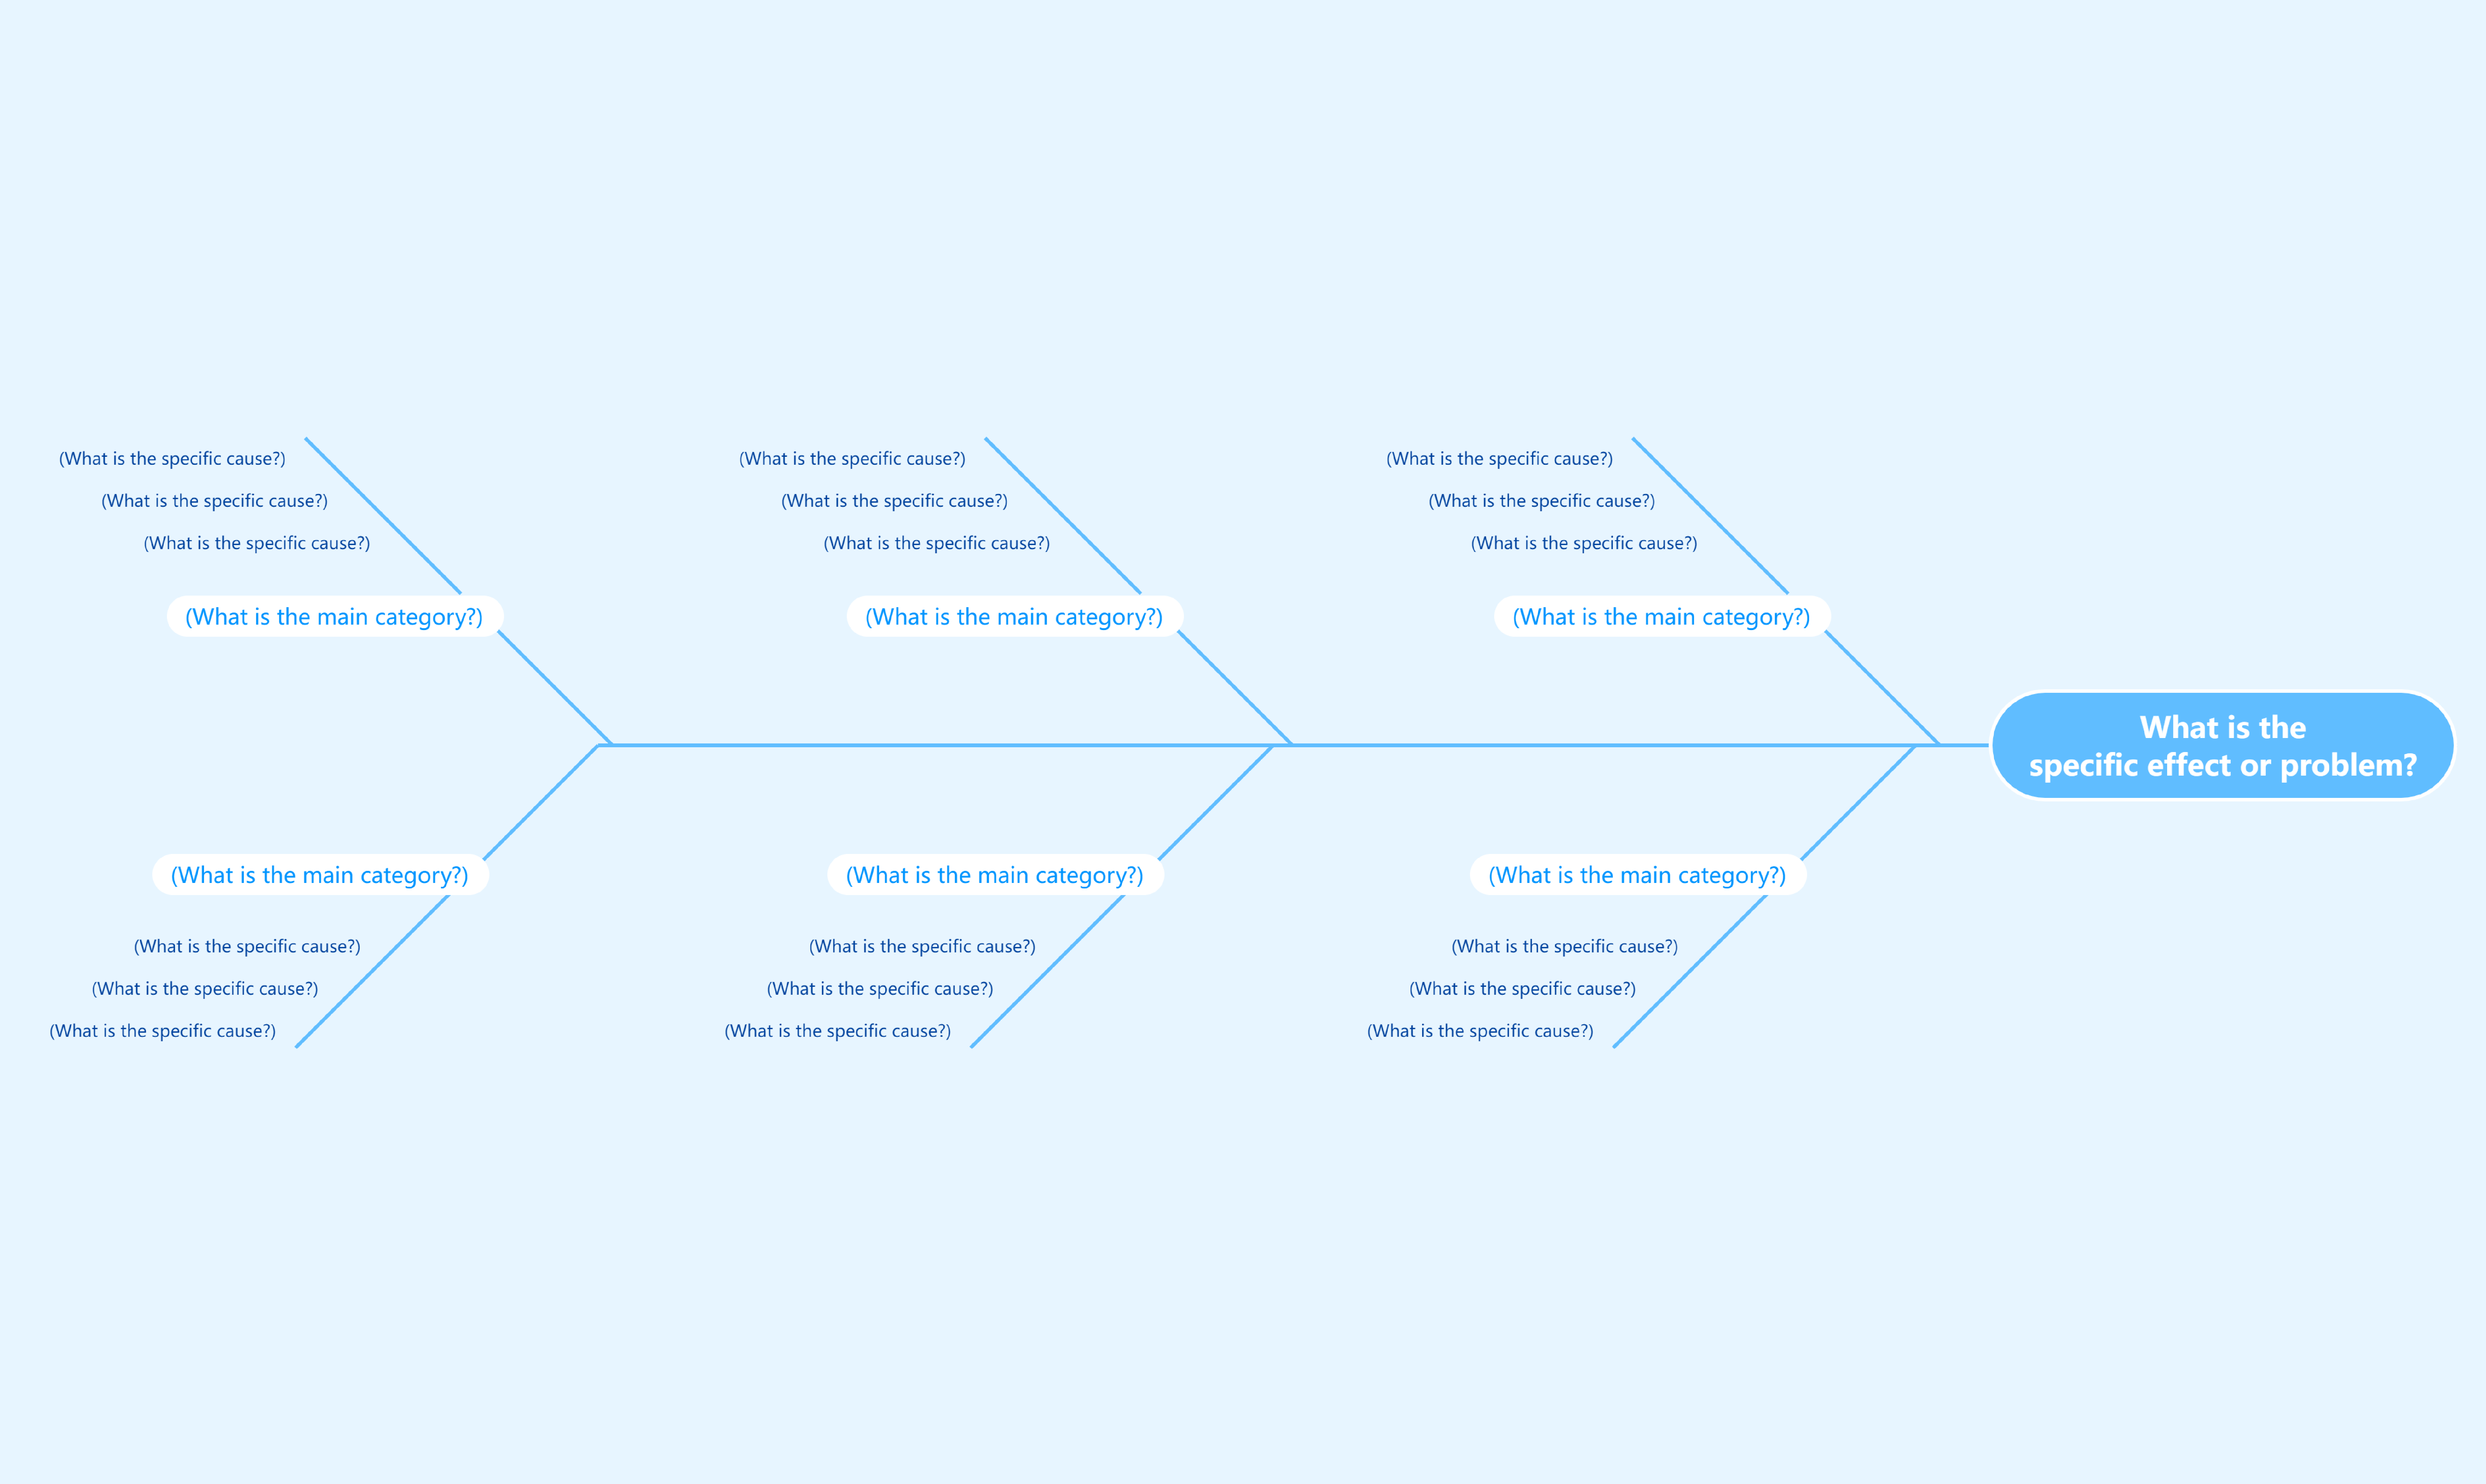
The Fishbone, or Ishikawa, Diagram is a visual tool widely used for cause-and-effect analysis to identify and understand the root causes of a problem or an effect. Developed by Kaoru Ishikawa, the diagram takes its name from its fishbone-like structure. The main problem or effect is depicted at the head of the fishbone, and potential contributing factors are illustrated as branches off the spine. These branches represent different categories of possible causes, such as people, processes, equipment, materials, and environment. By systematically exploring these categories and their subcategories, teams can uncover and analyze the interconnected factors that may be influencing the issue at hand. The Fishbone Diagram is an effective method for teams to visualize complex problems, fostering a collaborative approach to problem-solving and aiding in the identification of solutions to address the root causes.
Art and Impact of the Fishbone Diagram
One of the captivating aspects of the Fishbone Diagram, also known as the Ishikawa Diagram, lies in its distinctive and visually engaging design, resembling the skeletal structure of a fish. This unique appearance adds a creative and memorable dimension to the process of cause-and-effect analysis. The main problem or effect is positioned at the head of the fish, while the contributing factors are articulated as branches extending from the spine, resembling fishbones. This not only makes the diagram aesthetically interesting but also serves a functional purpose by organizing complex information in a clear and structured manner. The visual nature of the Fishbone Diagram enhances collaboration within teams, making it an effective and memorable tool for problem-solving and root cause analysis in various industries and contexts.
Digital Twist with Visual Paradigm Smart Board
Creating a Fishbone Diagram is now more accessible and dynamic, thanks to the innovative features of Visual Paradigm Smart Board. Instead of relying on traditional methods, this digital platform offers a modern and collaborative approach to constructing Fishbone Charts. With its user-friendly interface, Visual Paradigm Smart Board facilitates the effortless creation and modification of fishbone diagrams. The platform provides an interactive canvas where teams can collaboratively brainstorm, identify causes, and visually represent complex relationships in a digital environment. Whether participants are in the same room or working remotely, the Smart Board enhances the efficiency of the Fishbone Diagram creation process. Visual Paradigm Smart Board thus transforms the traditional approach into a digital, engaging, and effective method for conducting cause-and-effect analysis, making problem-solving more dynamic and collaborative.