Exploring Data Visualization with Mind Map
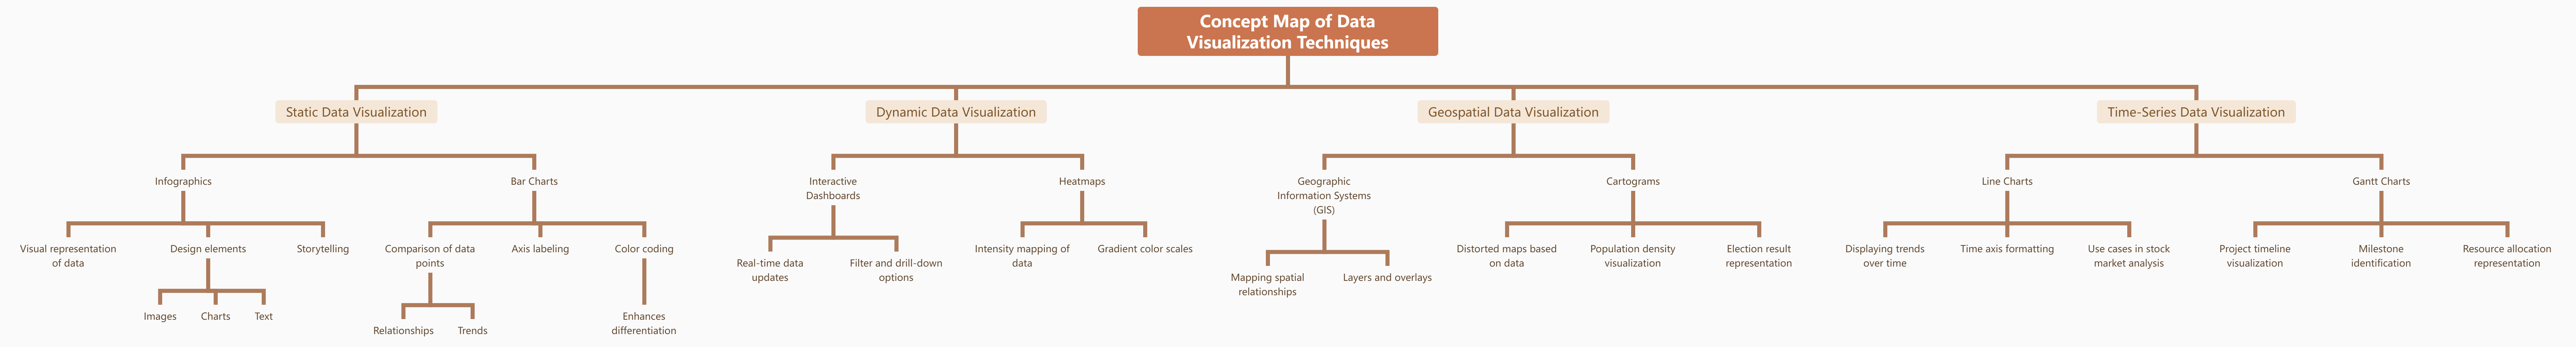
This concept map explores various data visualization techniques, categorizing them into static and dynamic forms. Under static visualization, it delves into infographics as a method incorporating visual elements and storytelling. It further details the application of bar charts, emphasizing their role in comparing data points and showcasing trends. On the dynamic front, the map highlights interactive dashboards that facilitate real-time updates and drill-down options. Additionally, geospatial data visualization, encompassing GIS and cartograms, as well as time-series techniques like line charts and Gantt charts, are intricately presented. This comprehensive map offers insights into the diverse techniques available for effective data representation.
Impact and Versatility of Data Visualization
Data visualization is a powerful method that transforms complex data sets into clear, insightful visuals, facilitating better understanding and decision-making. By representing information graphically, patterns, trends, and correlations become readily apparent. Businesses utilize data visualization to communicate performance metrics, market trends, and key insights, fostering informed strategies. In the realm of analytics, it enhances the interpretation of large datasets, aiding in uncovering actionable insights. Educators employ it to simplify complex concepts, making learning more engaging and comprehensible. Overall, data visualization is a versatile asset across various fields, promoting effective communication, analysis, and interpretation of information.
Effortless Concept Map Creation with VP Smart Board
Unlock your creativity effortlessly with VP Smart Board—a tool designed to streamline the creation of concept maps. Whether you’re visualizing data relationships, exploring digital marketing strategies, or mapping the intricate landscape of ancient civilizations, VP Smart Board provides an intuitive and user-friendly platform. With a range of features for static and dynamic data visualization, this tool empowers users to organize ideas, showcase relationships, and enhance understanding. Elevate your concept mapping experience with VP Smart Board, making complex concepts simple and engaging.