Crucial Qualities for Effective Leadership
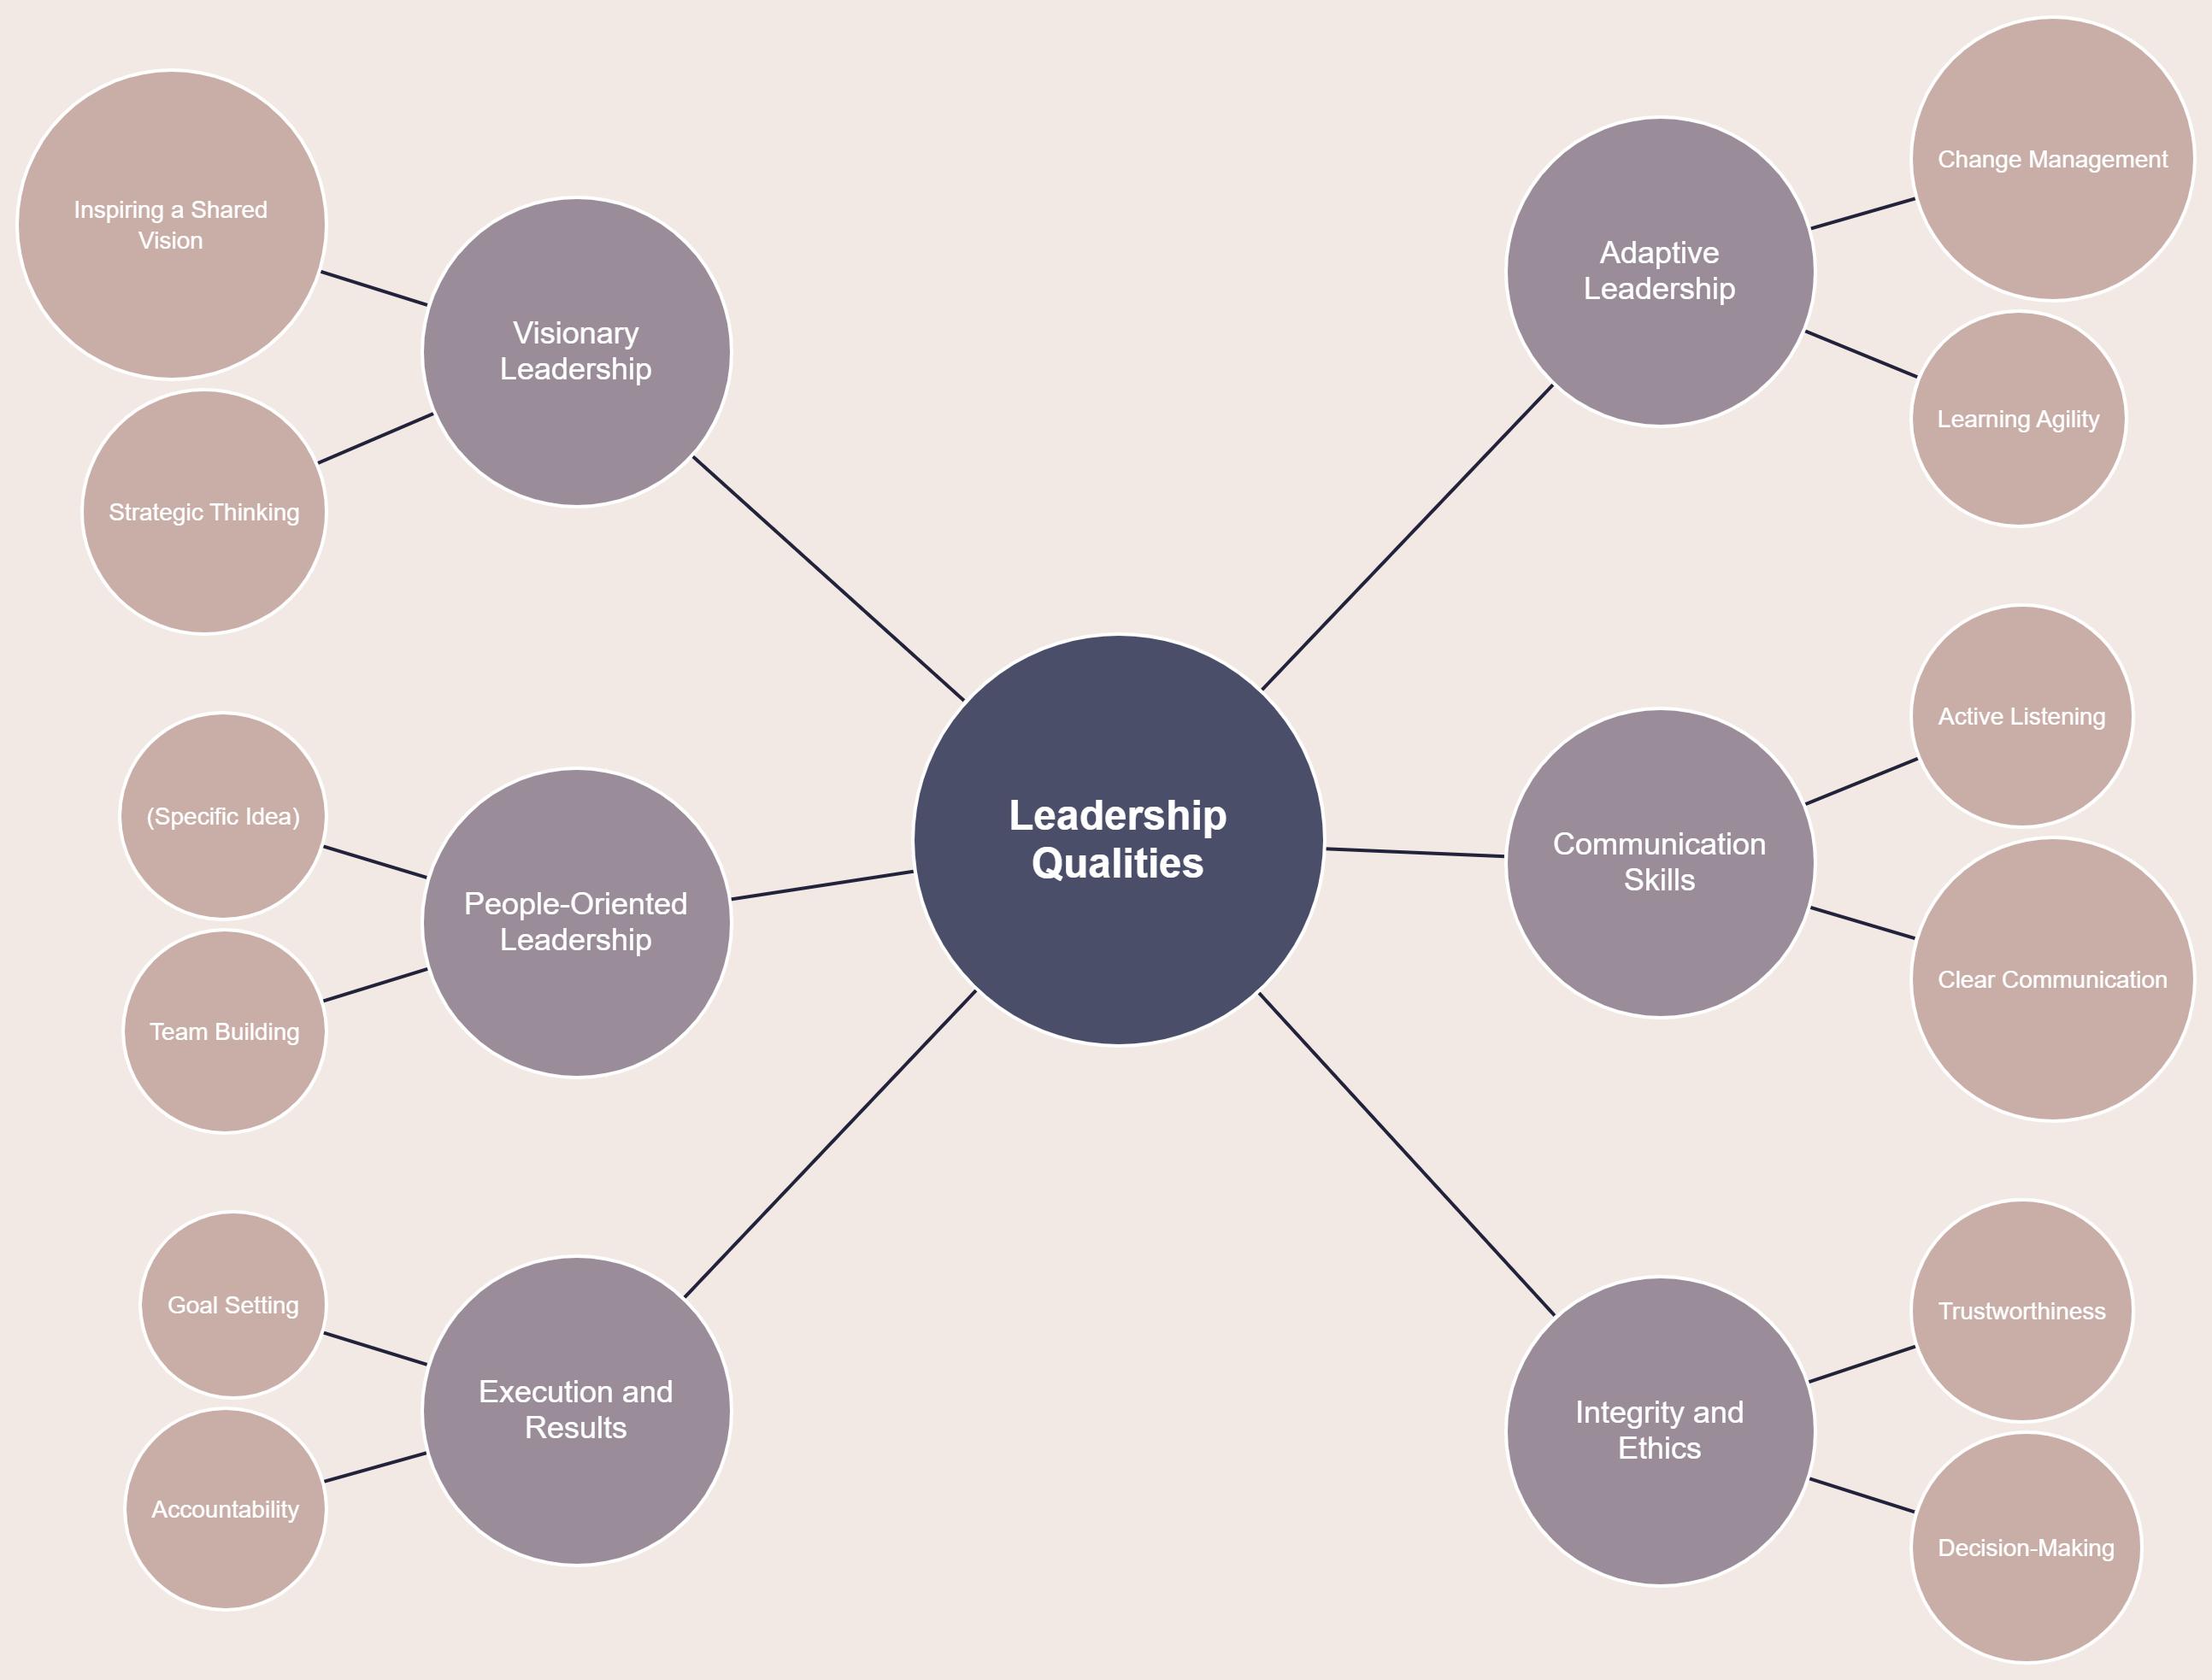
The mind map on Leadership Qualities provides a comprehensive exploration of essential traits that contribute to effective leadership. The qualities are categorized into distinct pillars, starting with Visionary Leadership, which emphasizes the ability to inspire a shared vision and strategic thinking. Adaptive Leadership is highlighted as a crucial aspect involving adept change management and learning agility to navigate evolving landscapes. People-Oriented Leadership delves into the importance of specific ideas and team-building skills, emphasizing the significance of fostering a positive and collaborative work environment. Communication Skills are showcased through active listening and clear communication, crucial elements for effective leadership. Lastly, Execution and Results encompass goal setting and accountability, reinforcing the leader’s role in driving outcomes. Integrity and Ethics are foundational, emphasizing trustworthiness and sound decision-making. This mind map insightfully presents a holistic view of leadership qualities, recognizing the multifaceted nature of effective leadership.
Ripple Effect of Leadership
Being a good leader is paramount in shaping a positive and productive work environment, directly influencing the overall efficiency and success of a team or organization. A skilled leader not only sets a clear direction and inspires a shared vision but also fosters a sense of trust, collaboration, and accountability among team members. A positive leadership style promotes open communication, active listening, and team building, creating a culture where individuals feel valued and motivated to contribute their best efforts. In such an environment, team members are more likely to embrace challenges, innovate, and work cohesively towards shared goals. The impact of a good leader extends beyond individual tasks to the overall efficiency of the workplace, contributing to higher morale, increased job satisfaction, and ultimately, enhanced organizational success.
Transforming Data into Insightful Bubble Charts
A bubble chart is a versatile data visualization tool commonly used to display three dimensions of data on a two-dimensional graph. It employs bubbles of varying sizes and colors to represent data points, with each bubble corresponding to a specific set of values. This type of chart is particularly useful for showcasing relationships and comparisons between data points in a visually intuitive manner. Visual Paradigm Smart Board makes the creation of bubble charts seamless and accessible. With its user-friendly interface and a range of templates, users can easily input and customize their content, transforming complex datasets into clear and engaging visual representations. Whether for business analytics, project management, or educational purposes, Visual Paradigm Smart Board streamlines the process of creating informative bubble charts, empowering users to convey data insights with ease.