Free Bubble Map Tool
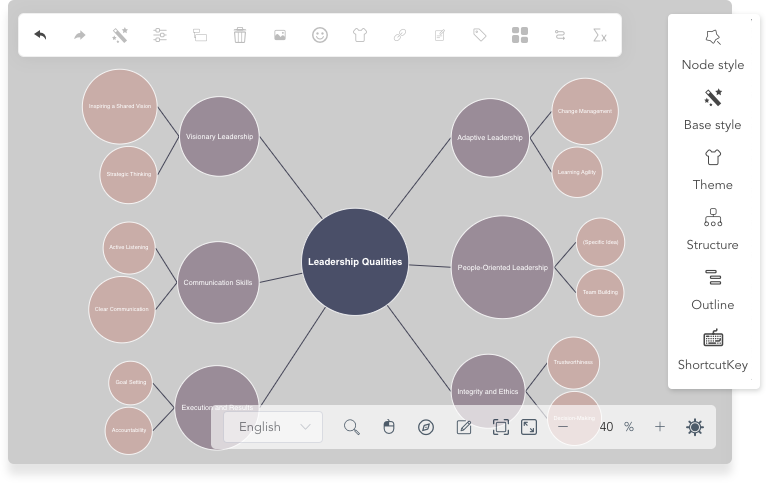
Discover the creative possibilities of our free Bubble Map tool! Effortlessly organize and visualize your ideas, concepts, and relationships in a dynamic and engaging format.

Discover the creative possibilities of our free Bubble Map tool! Effortlessly organize and visualize your ideas, concepts, and relationships in a dynamic and engaging format.


Supercharge your idea generation with the dynamic bubble map tool. This innovative tool empowers you to explore new concepts and connections, unleashing a flood of fresh ideas. With its intuitive interface and visual approach, the bubble map tool enables you to capture and organize your thoughts in a fluid and engaging manner.
Set your creativity free and embark on a journey of endless possibilities as you design captivating mind maps that leave a lasting impression. Give wings to your imagination and create fishbone diagrams that authentically showcase your unique vision and ideas.


Experience instant clarity as you effortlessly visualize the connections, dependencies, and progress of each element at a single glance. Our tool leaves no room for crucial details to be overlooked, ensuring you maintain a comprehensive overview of your projects with ease.

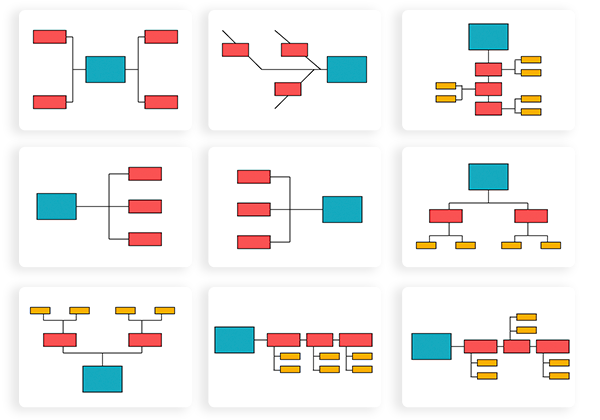
Discover our extensive collection of carefully curated templates, thoughtfully designed to accommodate various preferences and perfectly align with your project or objective.

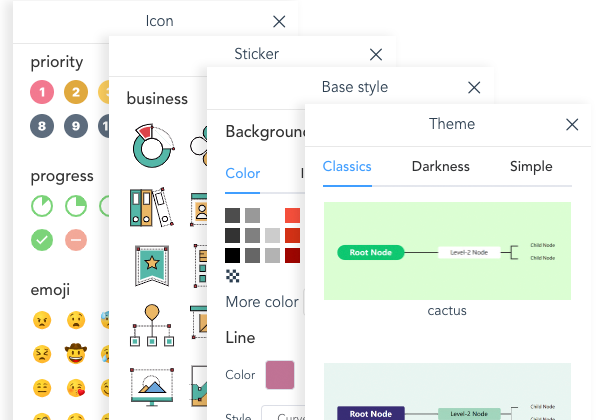
Elevate the visual appeal of your Bubble Maps with our tool's Image, Icon, and Sticker features, allowing you to enhance the overall impact and creativity of your maps.

Effortlessly export your creations to various formats, including JSON, images, SVG, PDF, markdown, and more.
Use clear and concise labels for each bubble in your map. The labels should accurately represent the main ideas or concepts associated with each bubble. Avoid using lengthy or ambiguous labels that may confuse the reader. A well-defined label helps communicate the core message of each bubble effectively.
Assign bubble sizes proportionally to the importance, significance, or quantity of the information you want to represent. Larger bubbles can indicate greater importance or larger quantities, while smaller bubbles can represent lesser importance or smaller quantities. This visual hierarchy helps prioritize and emphasize key ideas within the map.
Utilize color and visual differentiation to categorize or group related bubbles within your map. By assigning different colors or visual elements to specific categories or themes, you can enhance the readability and organization of the map. This approach helps viewers quickly identify and understand the relationships between bubbles.
Clearly illustrate the connections between bubbles by using lines or arrows. These connections represent relationships, dependencies, or associations between the ideas or concepts represented by the bubbles. Ensure that the lines or arrows are labeled appropriately to indicate the nature of the connection, such as cause and effect, similarity, or hierarchy. This clarity in connections helps viewers navigate and comprehend the overall structure of the map.
Bubble Map tool offers several advantages that can enhance your ability to organize, analyze, and present information effectively.

Effortlessly structure your thoughts and ideas using our user-friendly Bubble Map tool, available at no cost.

Discover our extensive collection of carefully curated templates, thoughtfully designed to accommodate various preferences and perfectly align with your project or objective.

Streamline collaboration and effortless sharing of your Bubble Map with others, fostering seamless understanding and smooth collaboration for all participants.